We hear it all the time: Demographics are changing. And of course, they are. But turmoil in higher education goes way beyond just the numbers of people who might be graduating from high school.
I’ve been doing a presentation on our campus to talk to people about how things are changing: Important economic and societal shifts that we in higher education cannot control. These changes over time have buoyed, and now threaten to weaken or sink, many institutions of higher education in the US.
Let’s look at a few of them. If you want these slides, they’re available for download via a link at the bottom. If you want to see the whole presentation, you’ll have to come work at DePaul. Most of the charts come from data visualizations on my other blog, where you can see the sources of the data and other notes.
First, High School Graduates:
The light blue bars show WICHE data with the number of high school graduates in the US over time, from 1996 to 2027. Years after 2012 are projected. The lines show the composition of that number, broken out by ethnicity; purple for Caucasian, red for Hispanic; orange for African-American, green for Asian, and blue for Native American. As you can see, numbers are at a low point, which is bad. They get better, which is good. But the composition changes, which, from a purely statistical standpoint, is bad.
Click on any of the charts for a larger view

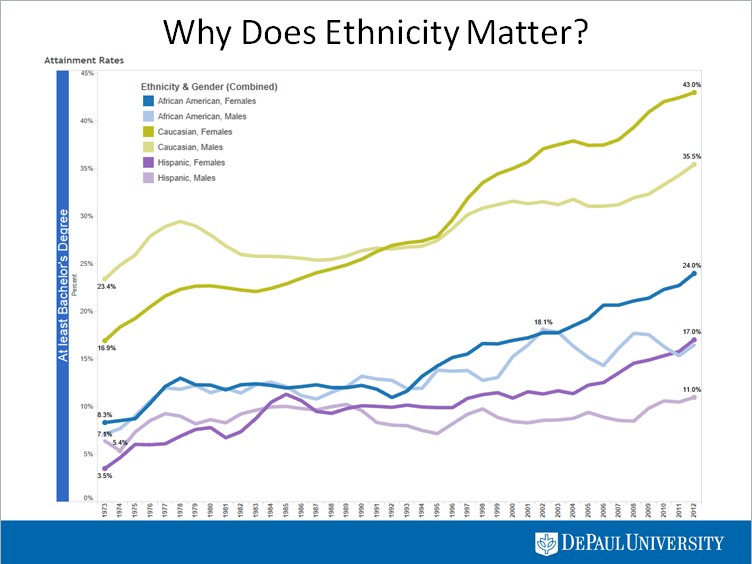
Why does the composition matter? Because race and ethnicity still matter in the US, for a lot of reasons. But statistically, different ethnic groups go to college at very different rates.
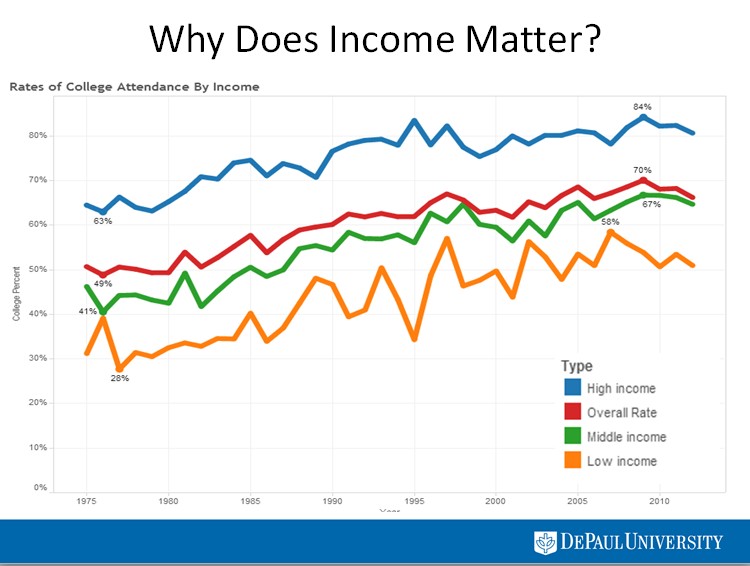
In case you were not aware, income also matters in the US. To no one’s surprise, students from wealthier families also attend college at greater-than-average rates.
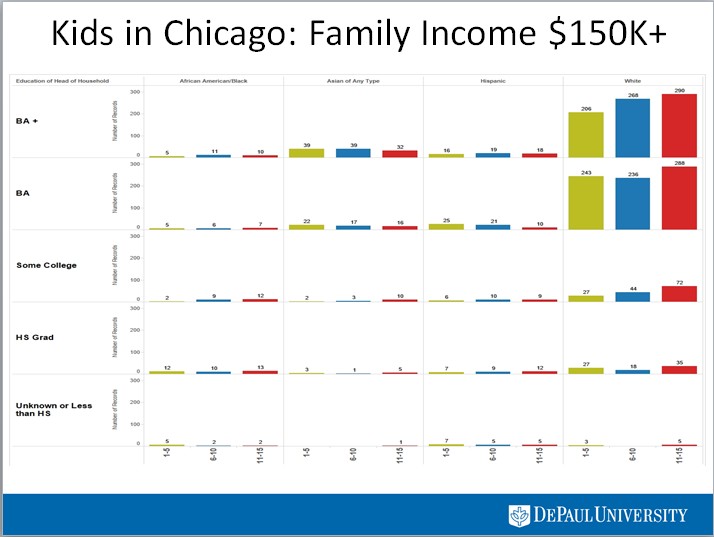
Do we have data on income? Yes, of course, if you look at PUMS Data from the American Community Survey (a 1% sample of the population, conducted annually). This is children by age group for families in Chicago with incomes of $150,000 or more. Note that these families have fewer younger children in (gold bars), and that parental educational attainment may be the single strongest predictor of a student’s propensity to go to and graduate from college :
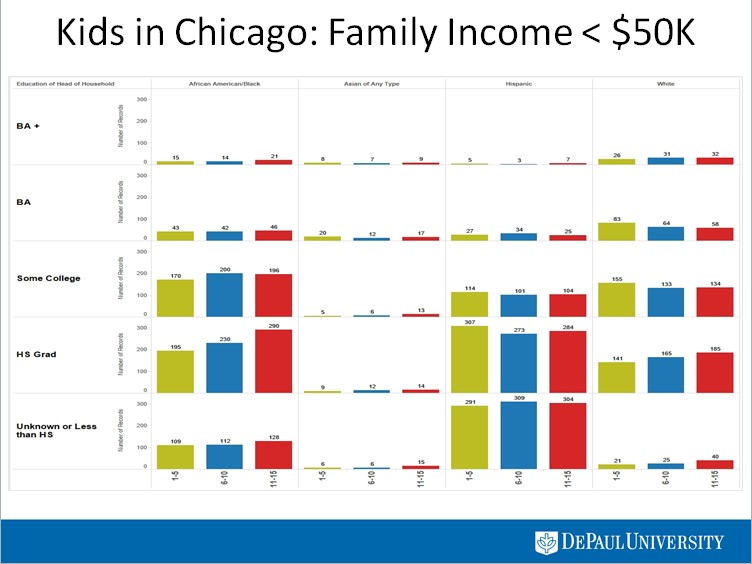
Now look at families in Chicago who will need aid–a lot of aid–to graduate: Based on parental attainment, income, and ethnicity, these students are far less likely to pursue any post-secondary education. And their populations are generally getting bigger. This is driving the “rebound” in high school graduates in coming years. Of course, this is just Chicago, but my visualization has all metro areas in the US (it’s too large to upload to the Tableau Public Server), and most areas look something like this, with local variance, of course.
So, if you thought things were tough now, it’s not going to get any better in the foreseeable future, especially if universities continue to do things the same way they always have.
These slides are available for download here.
